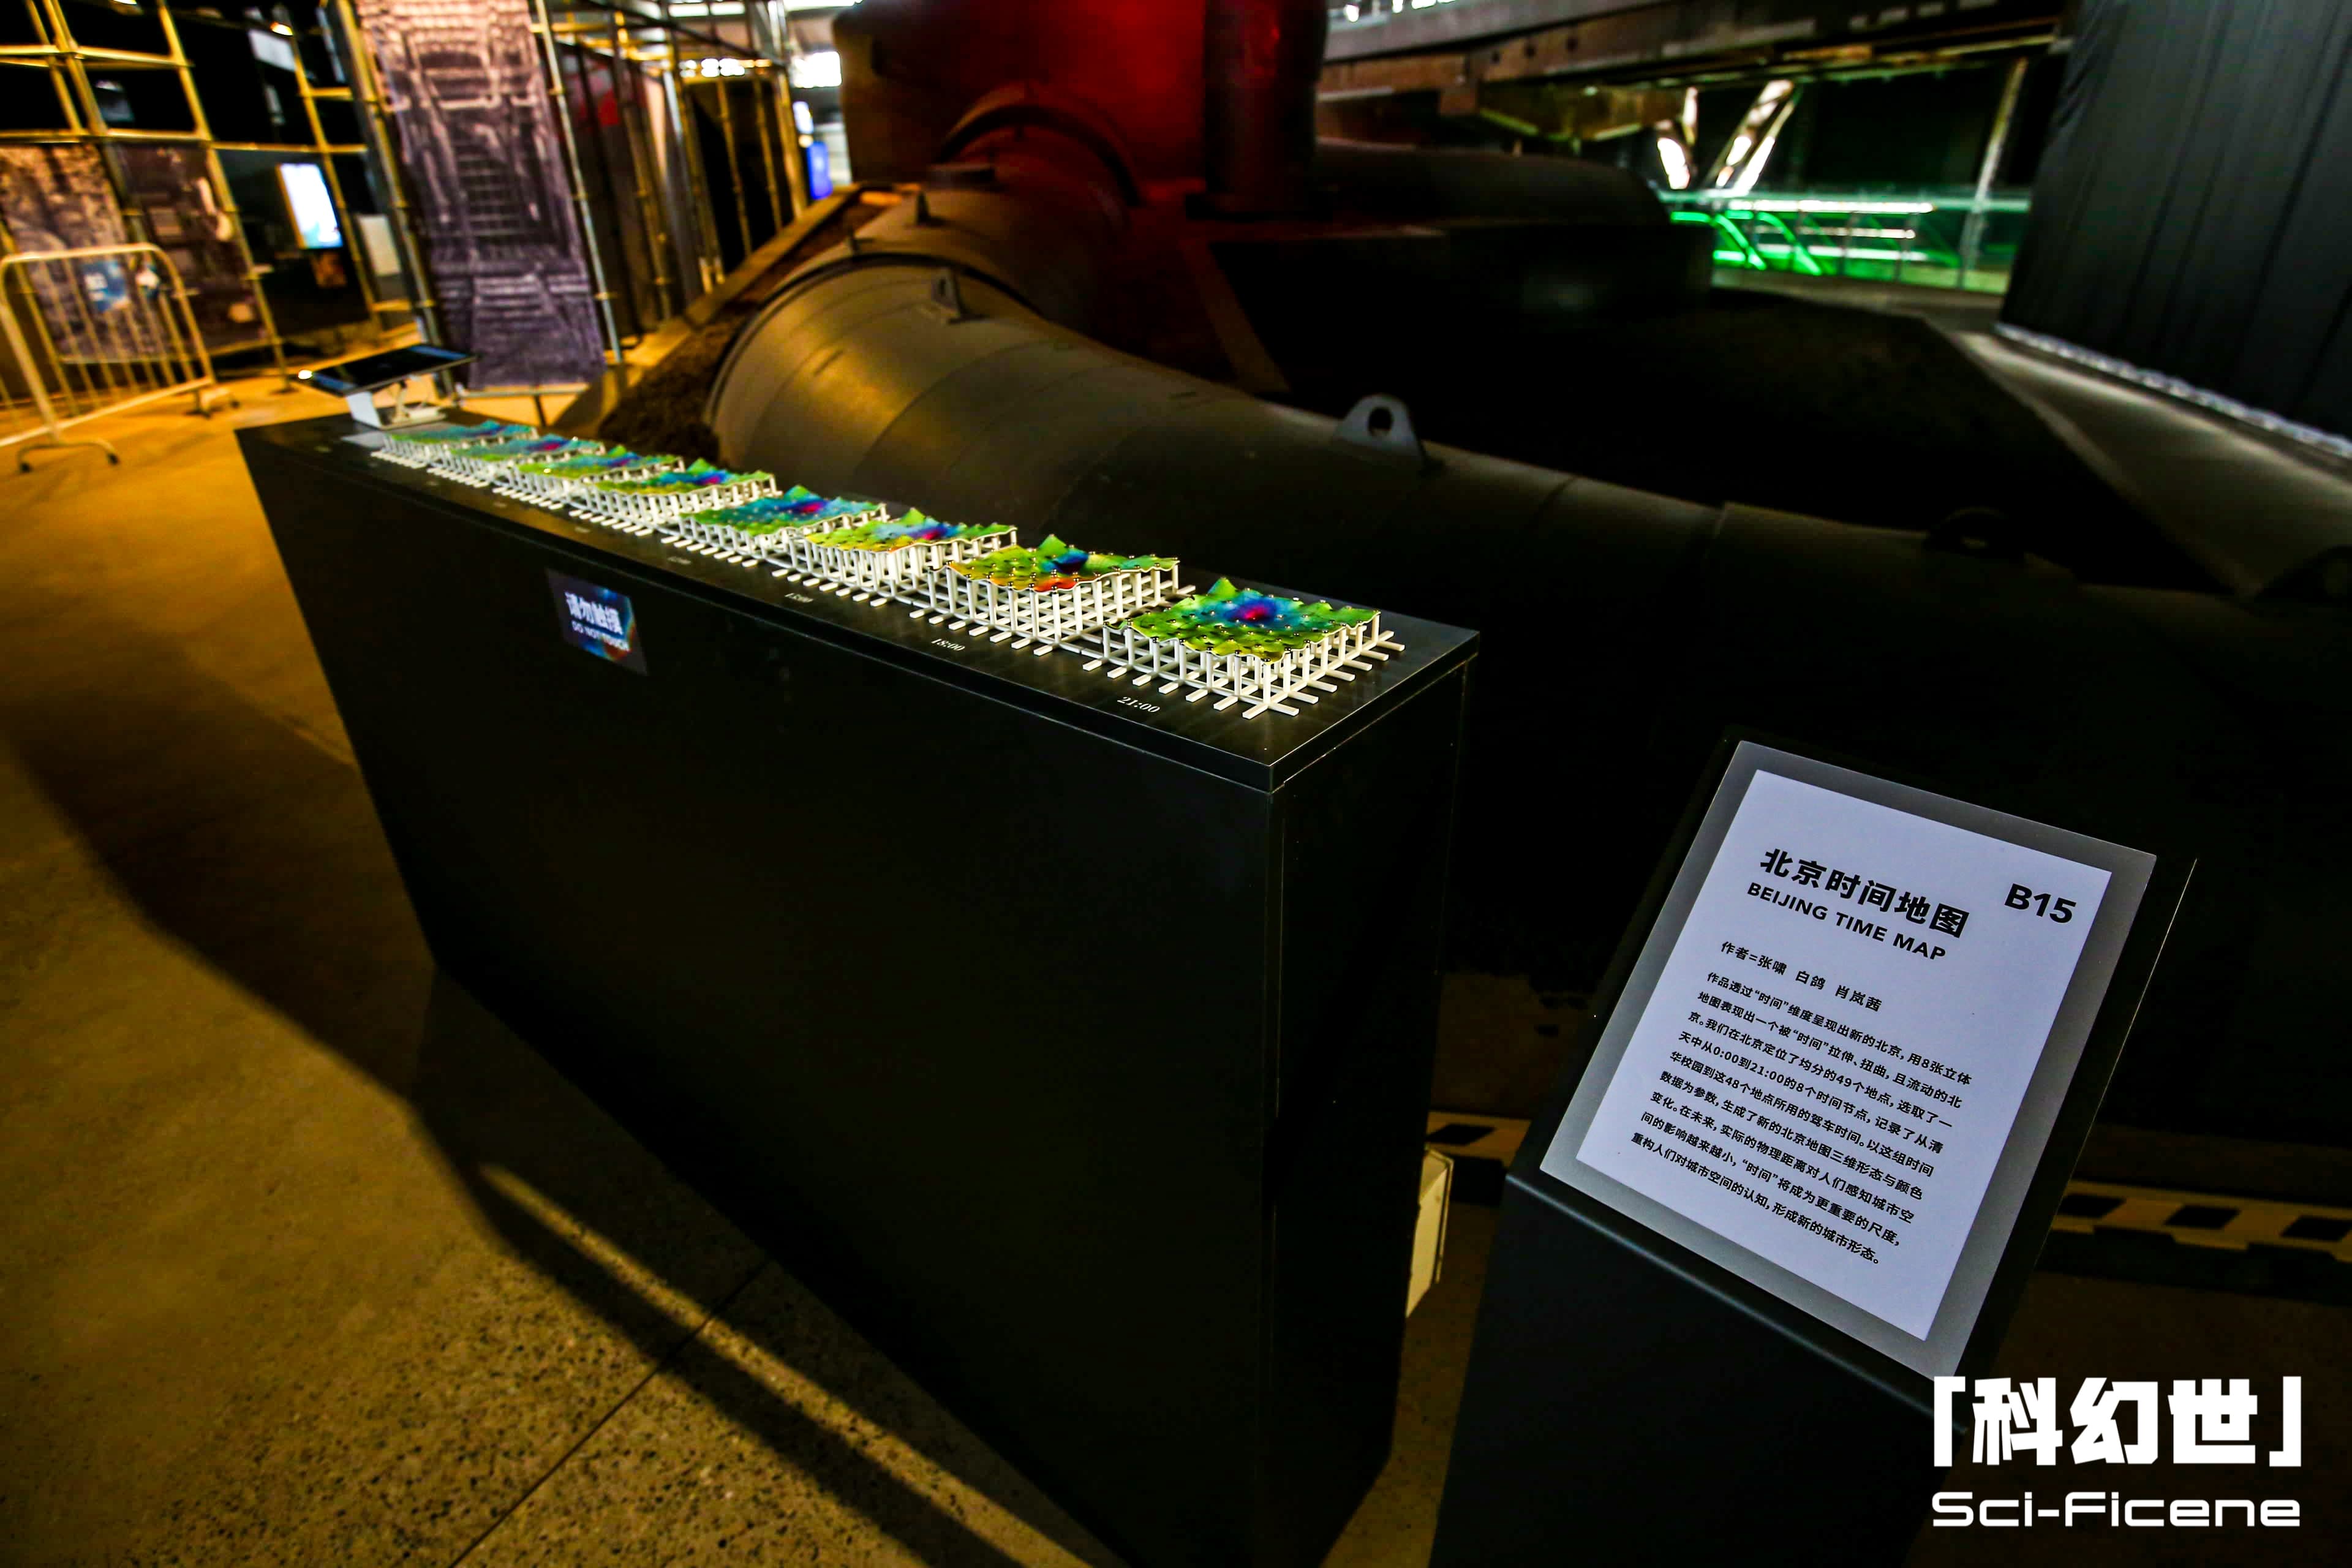
Beijing Time Map
When time transcends physical distance to become a more significant scale for perceiving urban space, how will future cities be reconfigured?
When time transcends physical distance to become a more significant scale for perceiving urban space, how will future cities be reconfigured?
This work presents a new Beijing through the dimension of "time," using 8 three-dimensional maps to show a city that is stretched, distorted, and fluid. We located 49 evenly distributed points in Beijing and selected 8 time points from 0:00 to 21:00 in one day, recording the driving time from the Tsinghua campus to these 48 other locations. Using this time data as parameters, we generated new 3D forms and color variations for the Beijing map. In the future, as physical distance becomes less influential in how people perceive urban space, "time" will become a more important metric, reshaping our understanding of urban space and forming new cityscapes.
In 2021, the work was exhibited at the "Sci-Fi World" Technology and Art Concept Exhibition, a sub-venue of Beijing Science and Technology Week.
 "Sci-Fi World" Technology and Art Concept Exhibition at Beijing Science and Technology Week
At different times, covering the same distance takes different amounts of time, which affects our perception of distance. For example, Xuetang Road during rush hour feels different in length than during off-peak hours.
At the same moment, different traffic conditions also affect the actual travel time for the same physical distance, influencing how we perceive it. For instance, at 6 PM, traveling 5 kilometers from Tsinghua to the Fragrant Hills takes only 26 minutes, but to the Chinese Academy of Sciences, it takes 50 minutes, making those 5 kilometers feel much farther.
When "time" surpasses physical distance as a more important measure for perceiving urban space, how will future urban spaces be reconfigured? This is the conceptual origin of our "Beijing Time Map." We aim to explore a "distorted" map of Beijing through a new perspective of visualization.
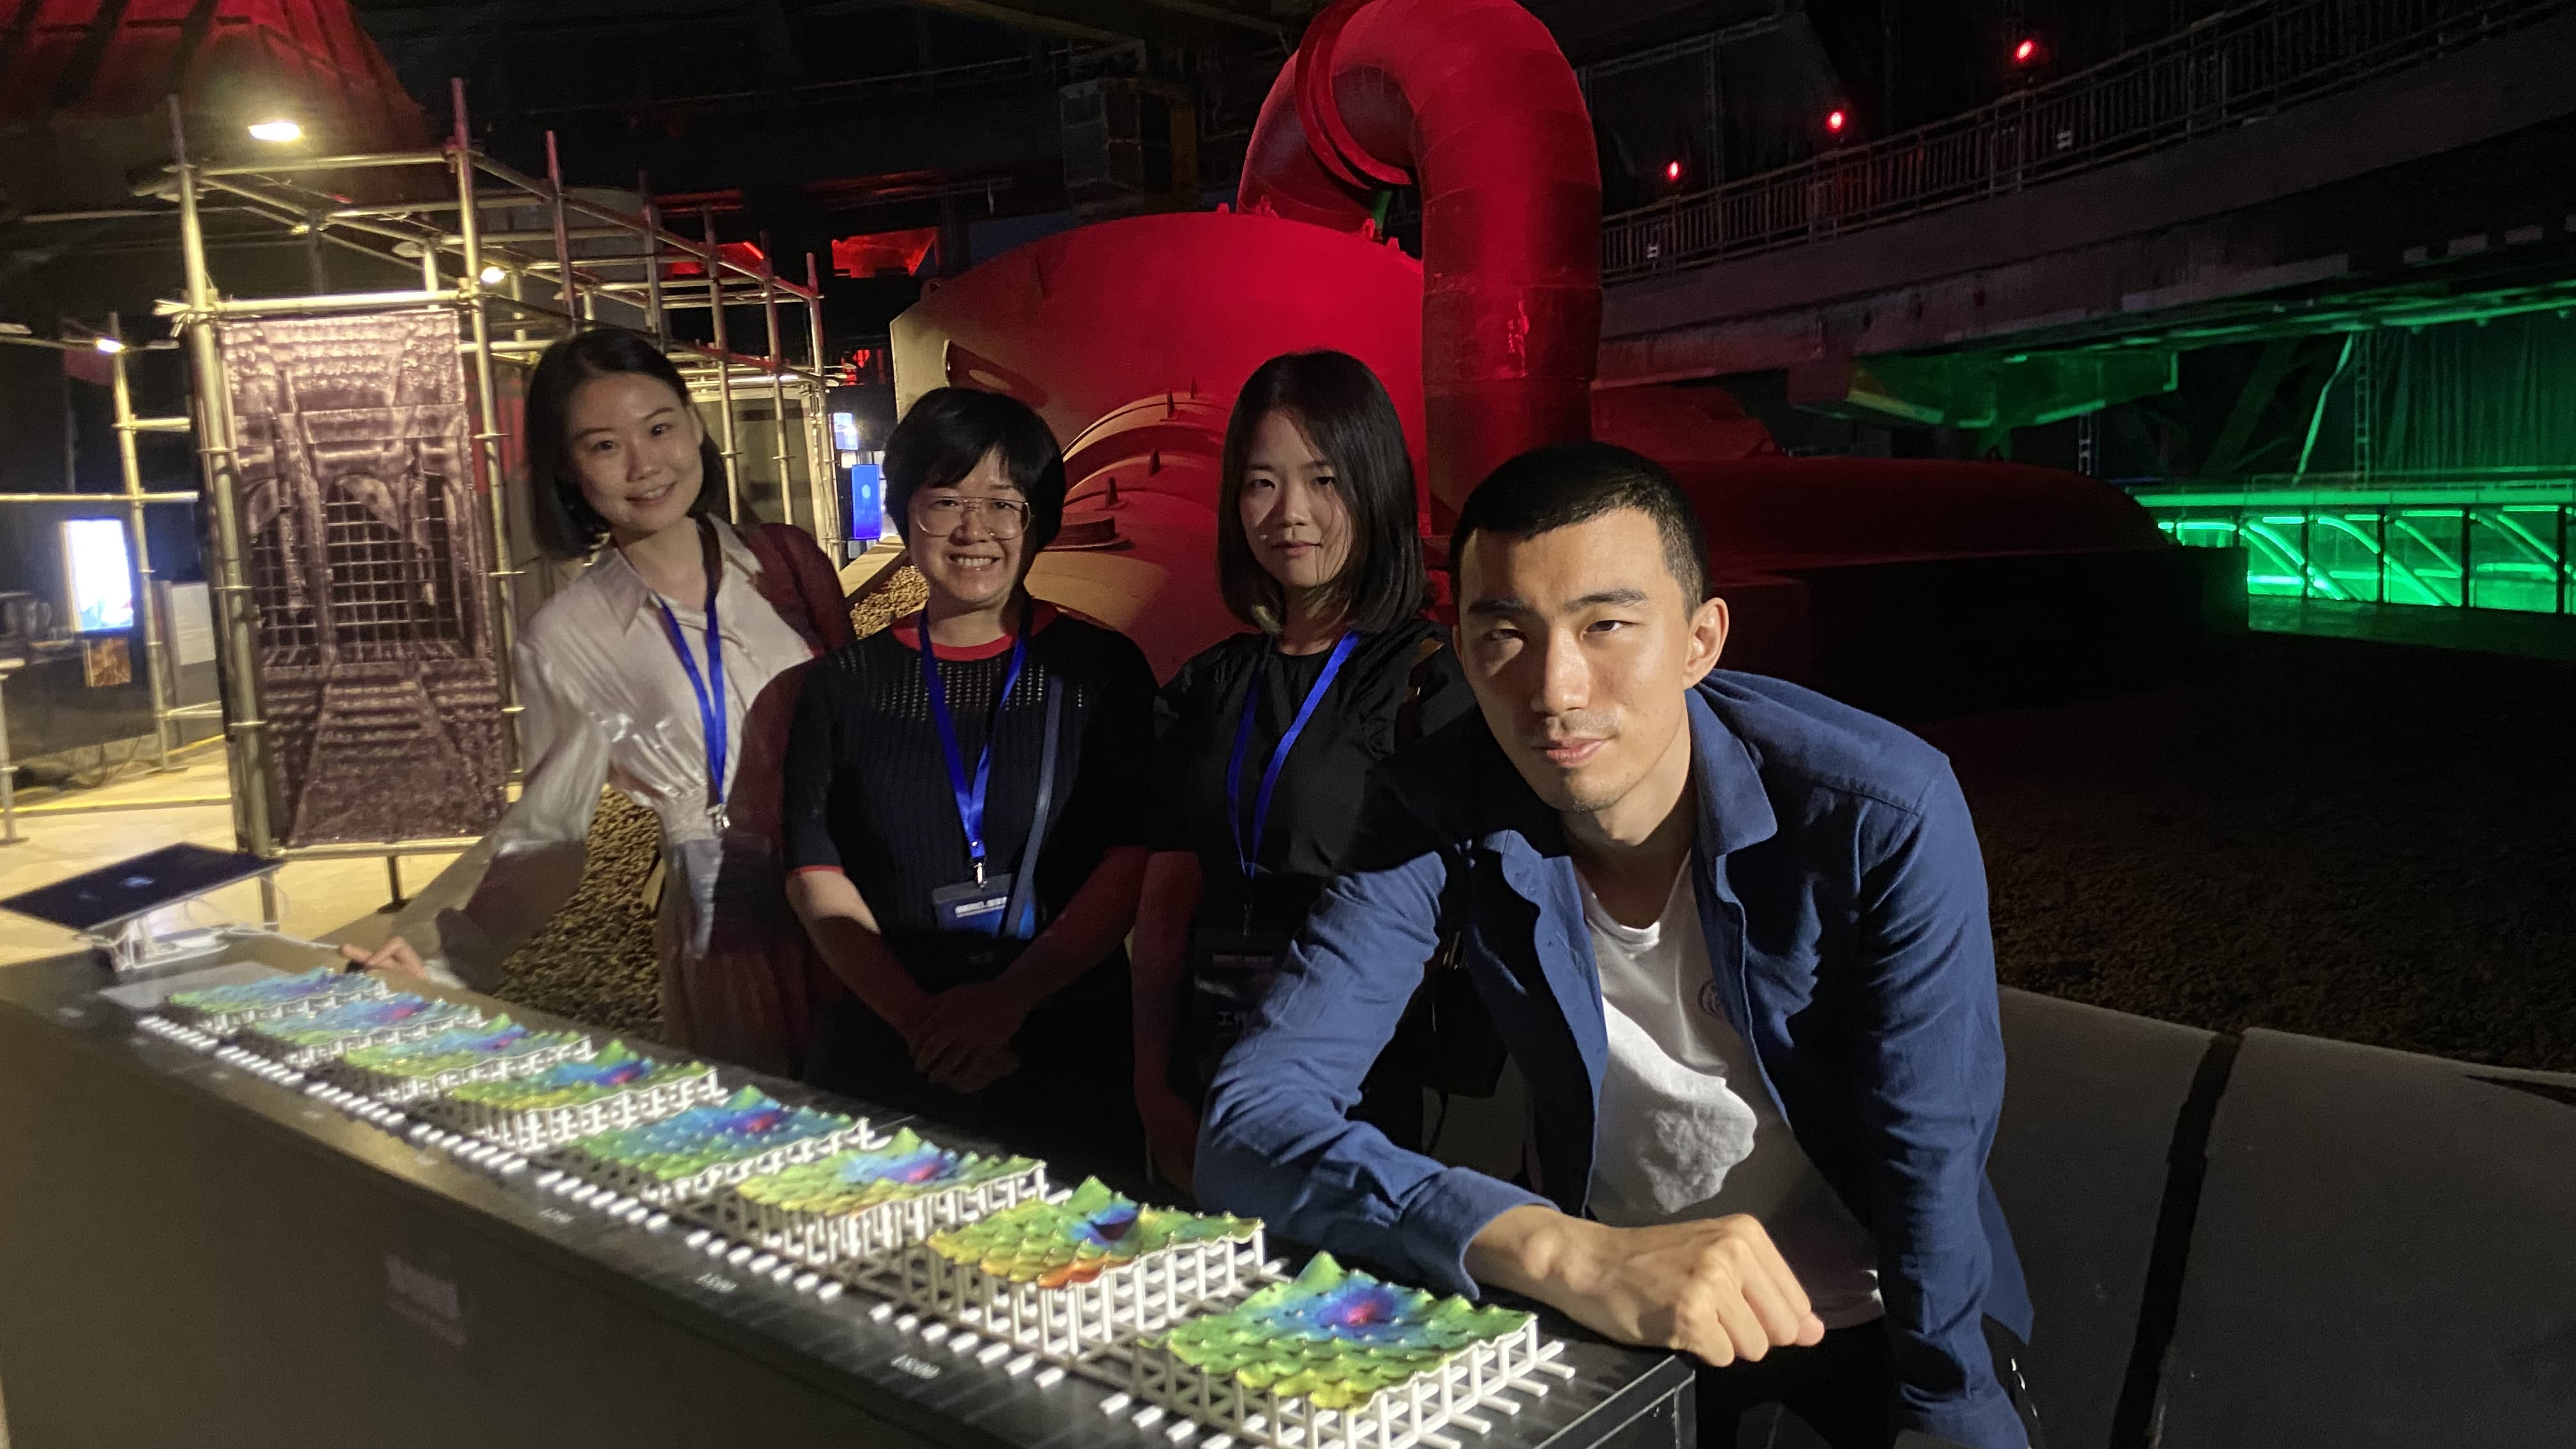
Due to the diverse disciplinary backgrounds of the creators—Xiao Zhang from architecture, Ge Bai from fashion design, and myself from information design—we hoped to create a set of physical Beijing Time Maps.
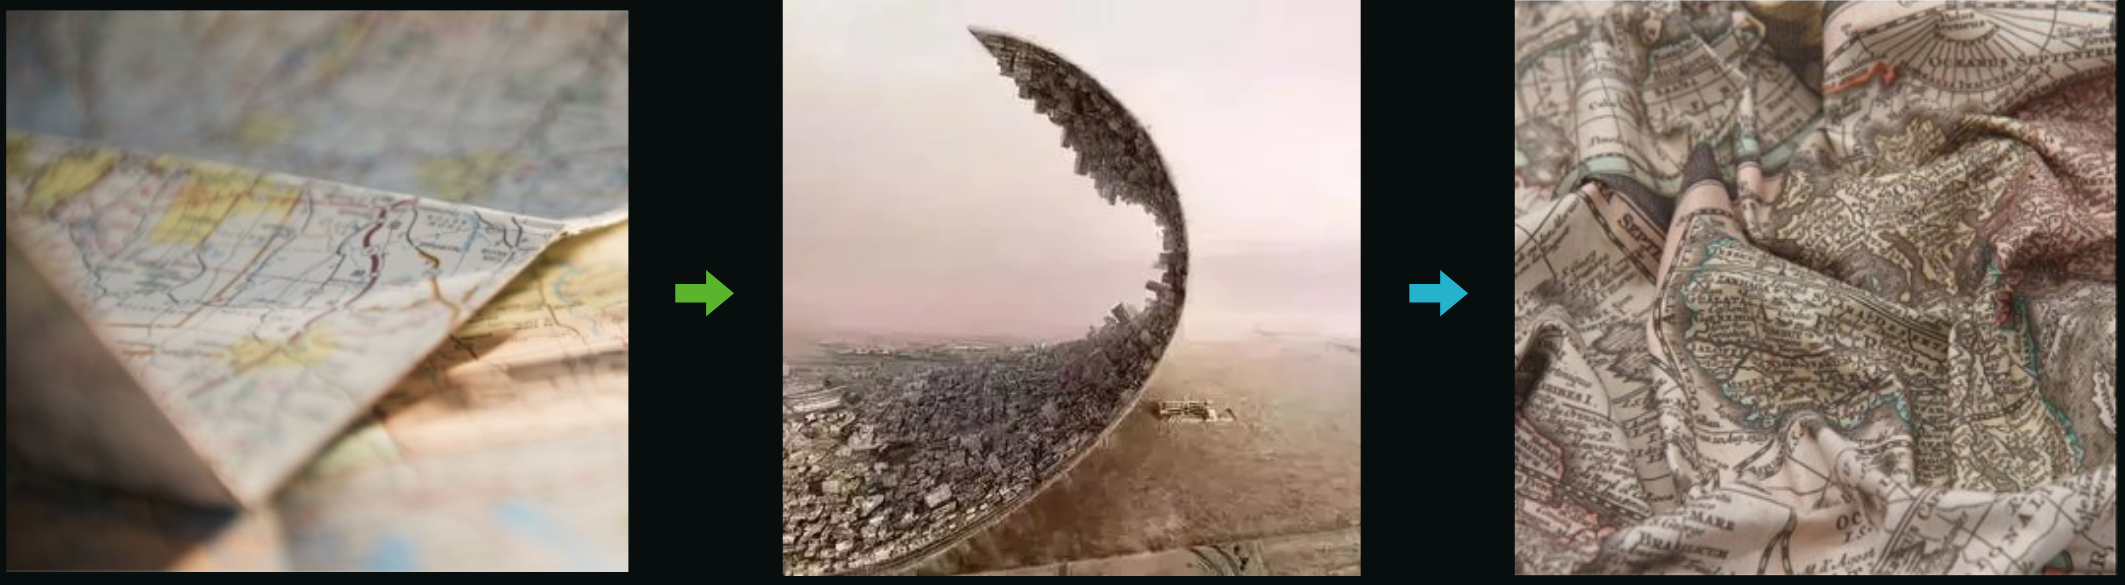 The concept map for "Folding Beijing" illustrates our idea well.
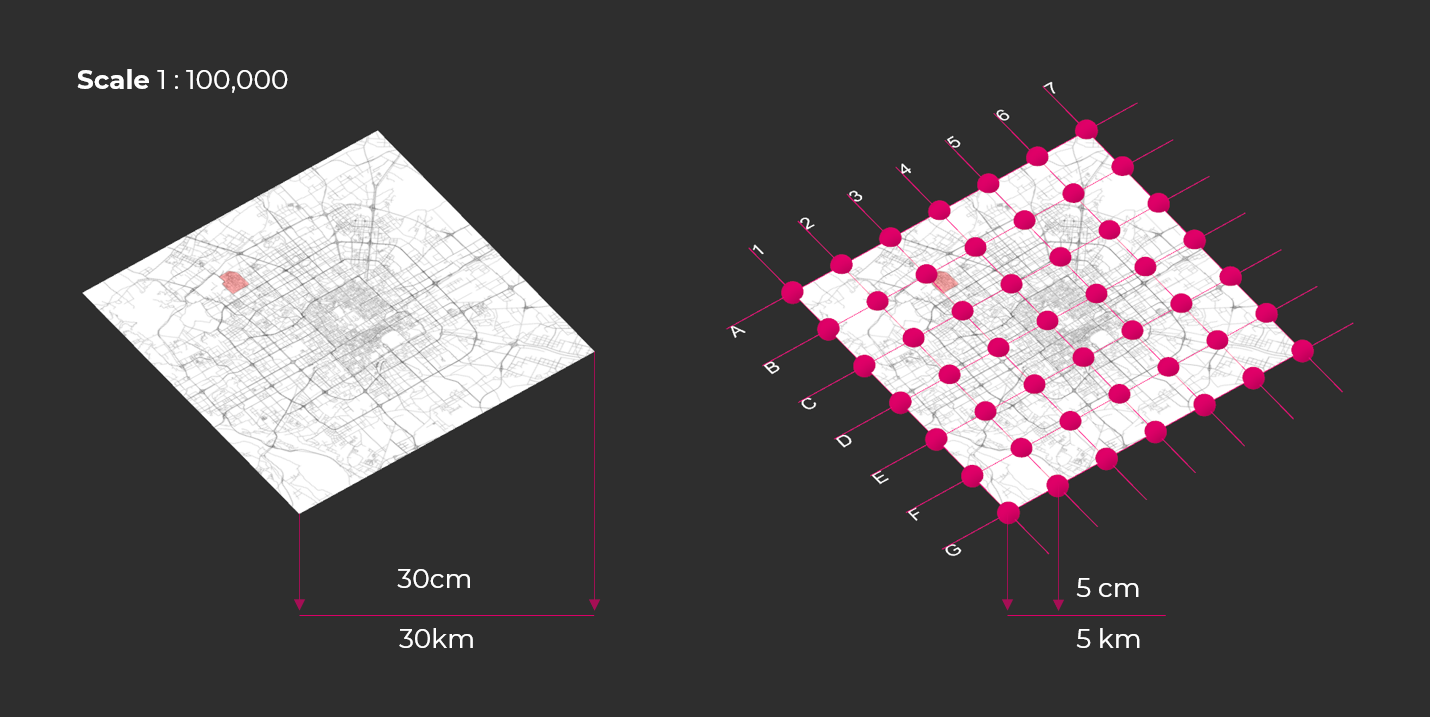
① Data Collection: We first set Tsinghua University as the starting point and located 49 evenly spaced points around it, with a minimum distance of 5 kilometers between adjacent points. We then selected 8 evenly spaced sampling times from 0:00 to 24:00 and used Baidu Maps' open data to record the driving time from the Tsinghua campus to the other 48 locations at these 8 time points on May 10, 2021.
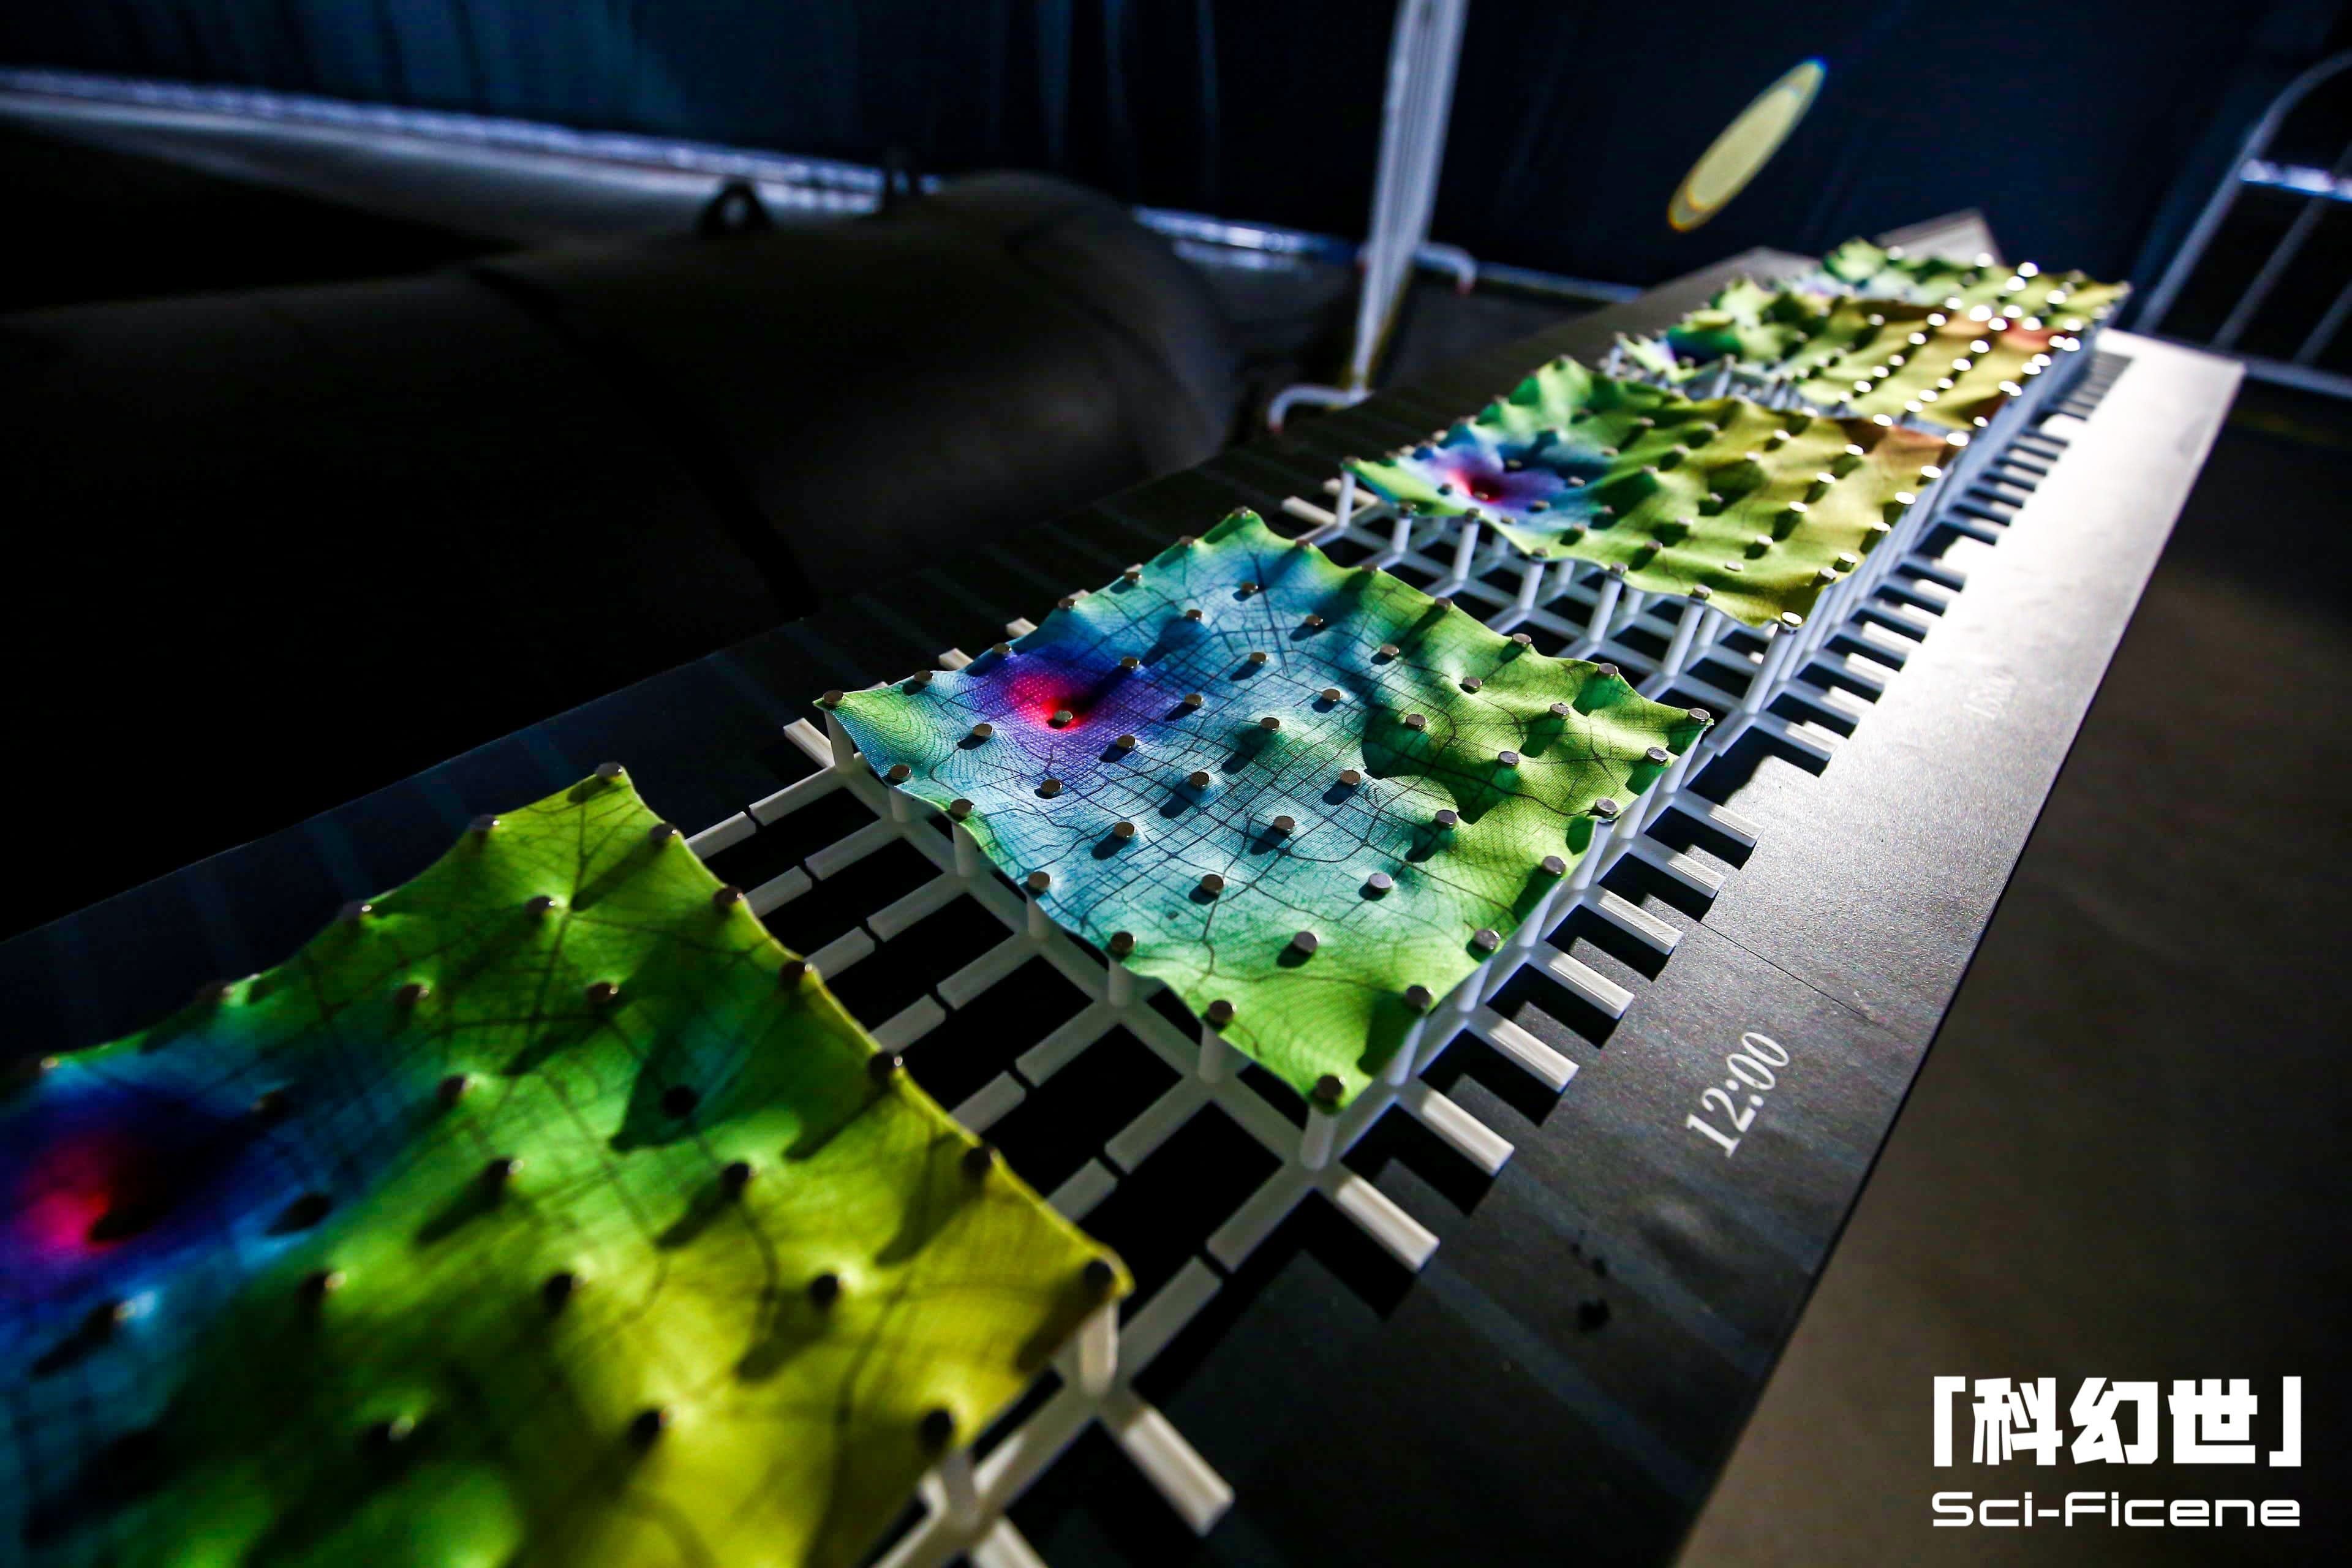
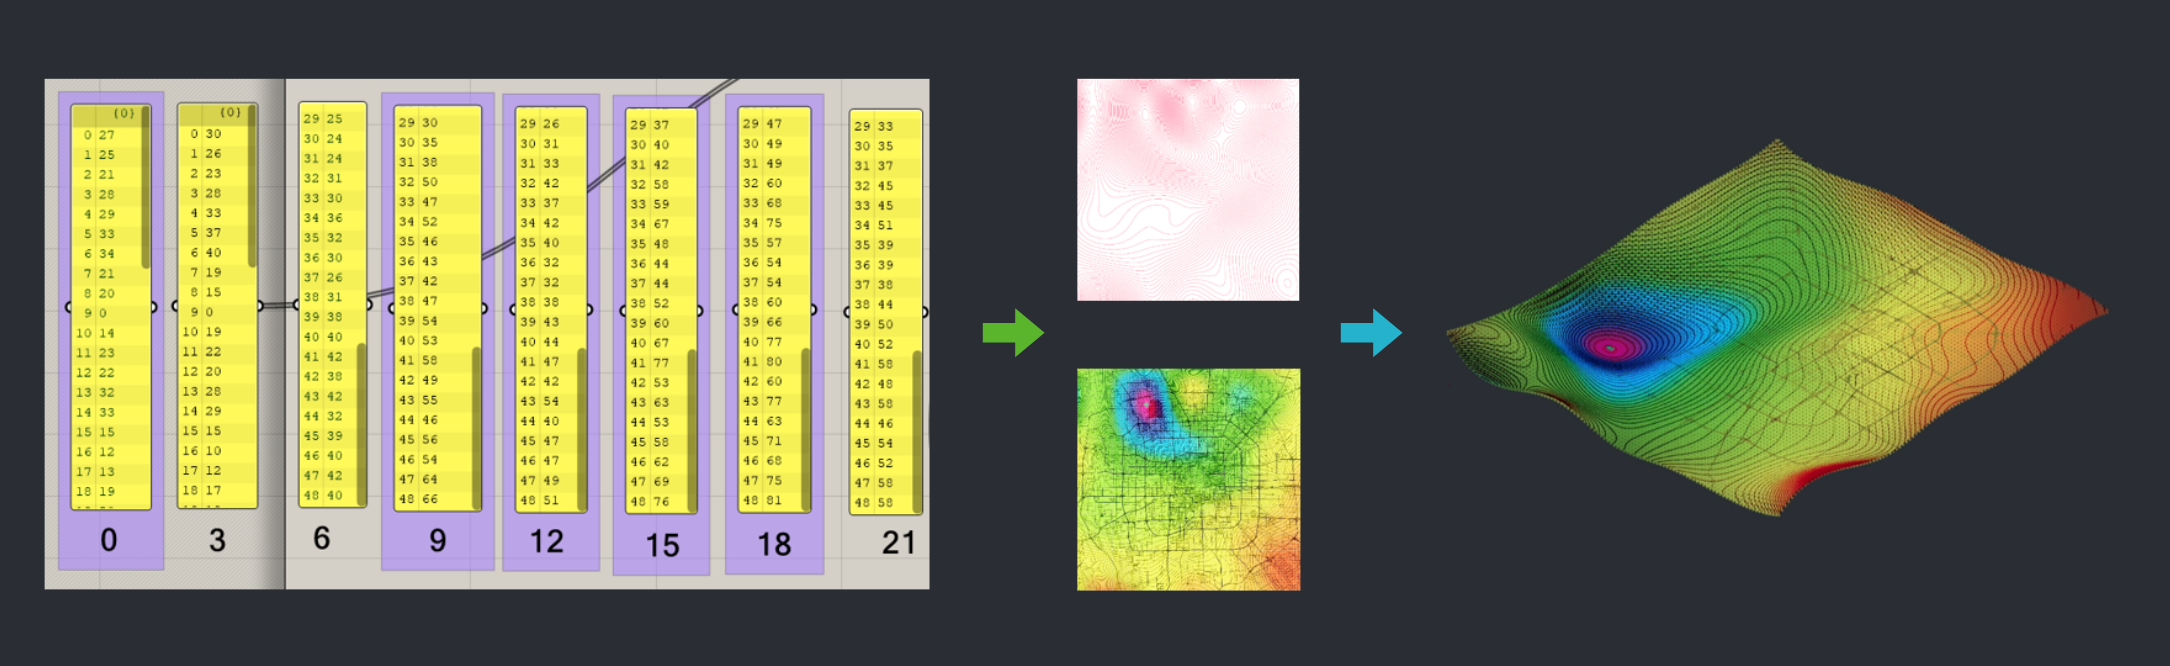
② Visual Generation: We imported the 8x48 data sets into Grasshopper, using geographic information for the x and y axes and time for the z-axis to distort the Beijing map. We then superimposed contour and heat maps of time onto the distorted map. This gave us 8 Beijing Time Maps for different times of the day.
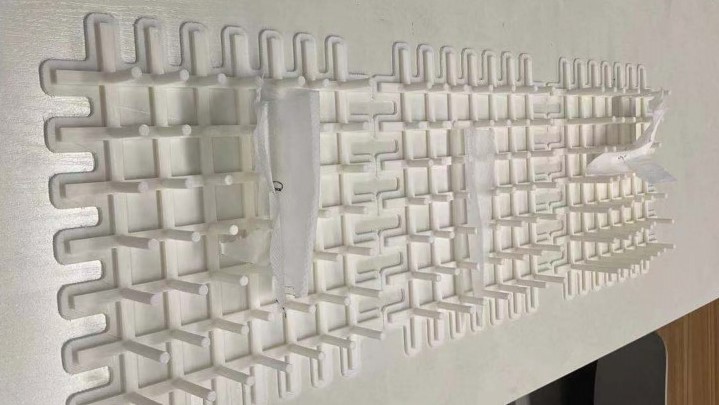
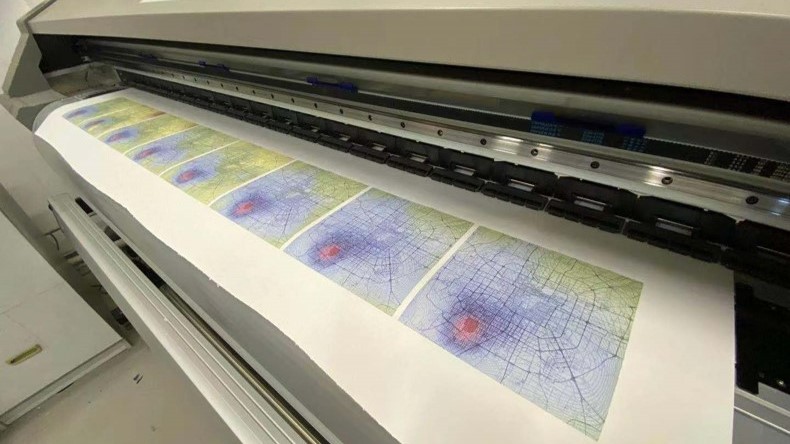
③ Physicalization: We used 3D printing to create the frames for the physical time maps, selected a suitably elastic fabric, and printed the top-down projection of the time maps onto the fabric. These were then assembled to create the physical Beijing Time Maps.
④ Final Effect: